
Hypothesis Tests for Proportion
This is also called the “p test”
When comparing proportions that are from a population with a fixed number of independent trails and each trial has a constant probability of one or another outcome (Bernoulli experiments) then we can use a p test. p is the probability of success, and 1-p is the probability of failure. Caution: stay consistent once you define success otherwise, like me, you’ll have a bit of confusion. n is the number of trials.
The exact way to solve these problems is with the Binomial distribution, yet when np and n(1-p) is greater than 5, then the normal distribution provides similar results. The use of the Binomial distribution is calculation intensive thus when possible we tend to use the normal distribution for the calculations.
Let’s say we want to compare a proportion, p, to a fixed value, po. Like other hypothesis tests we have three comparisons possible. The null hypothesis, Ho, could be equal to, greater than, or less than the fixed value, po. The alternative hypothesis Ha, defines the contrary conditions.
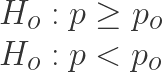
The three cases then are:
The population proportion of successes is equal to a fixed (given) value.

The population proportion of successes is less then or equal to a fixed value.
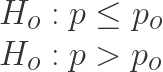
The population proportion of successes is greater than or equal to a fixed value.
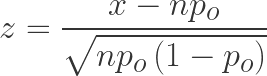
The test statistic is given by
Where
x is the number of successes out of the
n trials
po is the fixed proportion being compared to the data.
A great way to remember the formula for the test statistic is the number of success in the sample is compared to the mean value, npo , and divided by the standard deviation, which is the square root of npo (1- po ).
Example Problem
Let’s consider an example. Let’s say we’re inspecting corn from a test field. If the inspection accepts 30% of the sample or better, we conclude the field produces corn that is as good as or better than an average field of corn. We sample 150 ears of corn and find that 60 of the sample of 150 failed the inspection. Is there convincing evidence the test field has a higher failure rate than an average field? Use alpha = 0.05.
Solution
The null and alternative hypothesis are

The test statistic is
The rejection region for α = 0.05 means we will reject Ho if

Using the sample data, first determine the number of successes, x = 60, (those that fail the test as we defined above).
To be certain we can use the normal approximation, check that npo = 45, and npo(1-po) = 105. Both are greater than 5, so we may proceed with the normal approximation.
The test statistic is then

Since the observed z value is greater than the test statistic it is in the rejection region and we reject the null hypothesis. We conclude that there is convincing evidence that the test field has a lower yield (higher inspection failures) then the expected average result.

Pingback: Hypothesis Test Selection | CRE preparation notes
Pingback: Sample Size and Z1.4 | Ask the Experts
Pingback: Two Proportions Hypothesis Testing | CRE preparation notes